
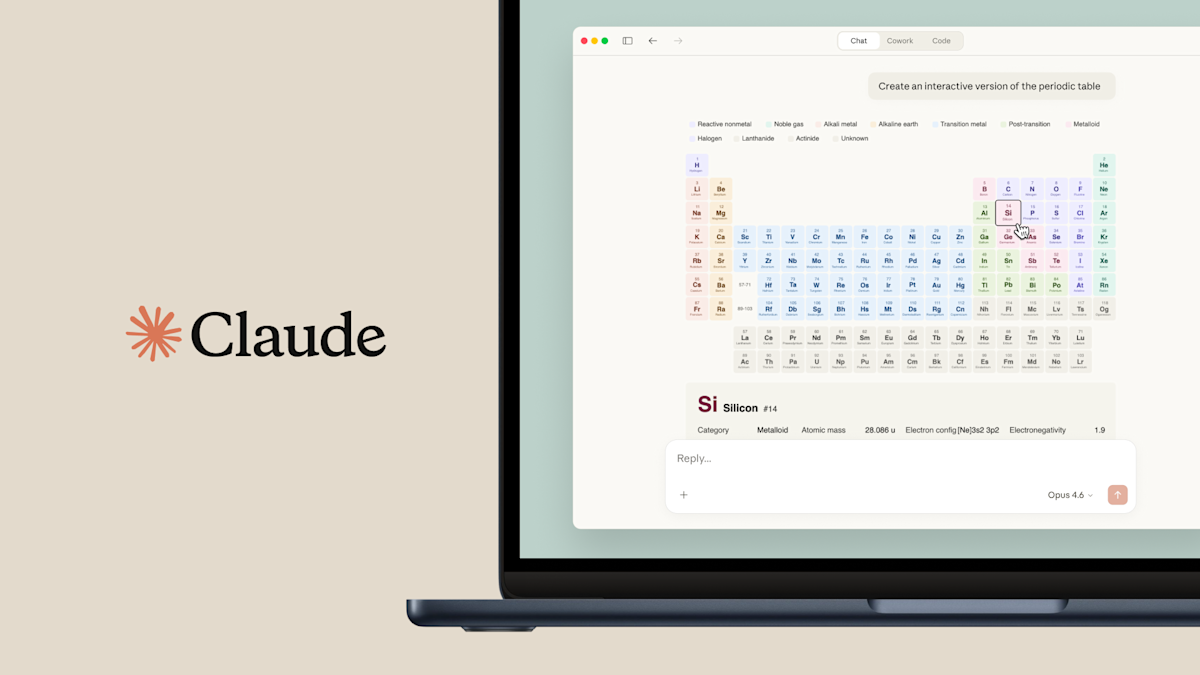
Claude Now Generates Charts and Diagrams in Chat
Key Facts
- What: Anthropic's Claude AI can now create charts, diagrams and step-by-step visual explanations directly within conversations using HTML and XML vector graphics.
- Availability: Rolling out today to all users, including free tier; enabled by default but currently unavailable on mobile.
- Beta status: Released as beta software with expected quirks; not true image generation.
- Differentiation: Visuals are transient within chats (unlike persistent Artifacts feature) and users can request modifications.
- Timing: Launches days after OpenAI added interactive visuals to ChatGPT for science and math explanations.
Anthropic is giving its rapidly rising chatbot Claude the ability to generate charts and diagrams directly in responses, expanding how it explains complex ideas to everyday users.
The new capability, announced and deployed starting today, allows Claude to produce visuals either when explicitly asked or when the model determines they would clarify a concept. Rather than relying on image generation models, Claude creates these aids using HTML code and XML vector graphics, which Anthropic compares to “giving Claude access to its own whiteboard.”
A practical example highlighted by the company involves asking Claude for the best way to fold a paper plane. Previously limited to text instructions, Claude can now display a step-by-step visual guide for folding a Nakamura lock plane. The feature arrives at a moment when Claude is seeing increased adoption among non-technical users, according to Engadget.
This release comes just days after rival OpenAI introduced similar interactive visual capabilities in ChatGPT, particularly for explaining science and math concepts. The competitive timing underscores the growing importance of multimodal output in the chatbot wars.
How It Works and Key Limitations
Anthropic has emphasized that the new visualizations are distinct from its existing “Artifacts” feature. While Artifacts open in a dedicated side panel, remain persistent, and can be interacted with, shared or downloaded, the new in-chat visualizations are transient — they change or disappear as the conversation progresses, according to reporting by The Verge.
Users retain significant control. They can ask Claude to modify the generated charts or diagrams, and the model can iterate based on feedback. The visualizations are turned on by default for all users across web interfaces.
However, several limitations exist in this initial beta release:
- Not yet available on mobile apps
- Beta status means users should anticipate occasional quirks or imperfect outputs
- Relies on code-based rendering rather than photorealistic image generation
The approach of using HTML and SVG-style vector graphics offers advantages in precision and editability compared to raster images, making it particularly suitable for technical diagrams, flowcharts, data visualizations and instructional step-by-step graphics.
Competitive Context and Claude’s Momentum
Anthropic’s move reflects broader industry pressure to make large language models more effective teachers and communicators. Visual reasoning has become a key battleground, with models like Claude 3.5 Sonnet already demonstrating strong performance in interpreting charts and graphs.
The timing is notable. OpenAI recently enhanced ChatGPT with interactive visuals focused on STEM explanations, while Anthropic’s implementation appears more general-purpose — capable of responding to a wide range of requests from organizational charts to folding instructions.
Community reaction has been positive, with some Reddit users noting that “Claude is actually good at generating diagrams.” Developers and technical users have long used Claude’s coding abilities to produce various visualization formats, but this represents a native integration that requires no special prompting or external tools.
Impact for Users and Developers
For regular users, this update significantly improves Claude’s utility as an explanatory tool. Complex topics in business, education, engineering and personal projects can now be clarified with custom visuals generated on the fly.
“This changes how people will learn and communicate with AI,” one industry observer noted, highlighting the shift from purely text-based interactions to richer multimodal conversations.
Developers and analysts stand to benefit particularly. The ability to request specific charts or system architecture diagrams within natural conversation could accelerate prototyping, documentation and data analysis workflows. Because the visuals are generated through code, they are often precise, scalable and modifiable.
The feature also carries implications for accessibility. Well-designed diagrams can help explain concepts to visual learners or users who struggle with dense text explanations. However, the current lack of mobile support limits its usefulness for many casual users who primarily access AI chatbots via smartphone apps.
What’s Next
Anthropic has not detailed a specific roadmap for this visualization capability beyond the current beta. Improvements will likely focus on expanding mobile support, reducing quirks, and potentially increasing the complexity and interactivity of generated visuals.
The company may also explore tighter integration between the new in-chat visualizations and its persistent Artifacts feature, allowing users to promote useful diagrams from conversations into shareable, editable projects.
As competition intensifies between Anthropic, OpenAI, Google and others, the sophistication of visual output is expected to become a major differentiator. Features that make AI feel more like a collaborative colleague — complete with whiteboard sketches — could drive significant user preference shifts.
For now, users can begin experimenting with the new capabilities immediately by asking Claude to generate diagrams, charts or visual explanations for any topic. The feature’s broad availability to free users represents a notable democratization of advanced AI visualization tools.
The rollout reinforces Anthropic’s focus on making Claude more practical and helpful for real-world tasks rather than pursuing pure generative image capabilities at this stage.